System and services metrics
Defaults dashboards
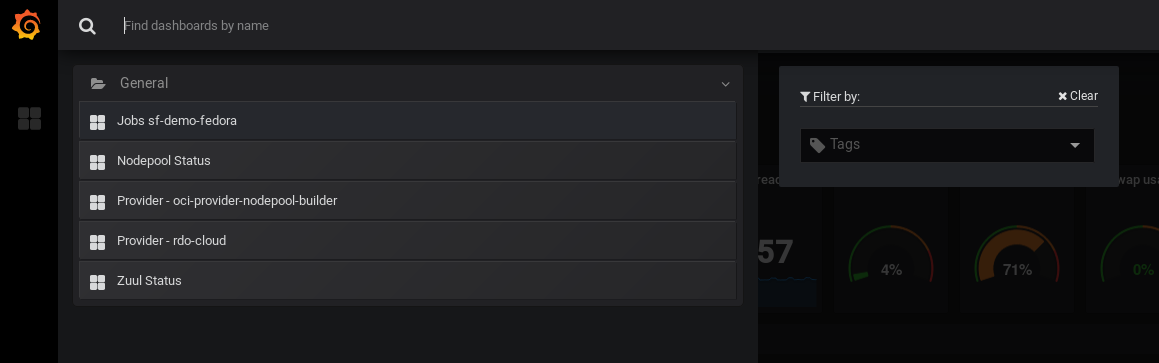
When metrics are activated on Software Factory, some defaults dashboards are created:
- system: a dynamic dashboard with all servers used in the deployment (except hypervisor-runc role)
- zuul: a status dashboard
- nodepool: a status dashboard and a dashboard per provider
Customs dashboards
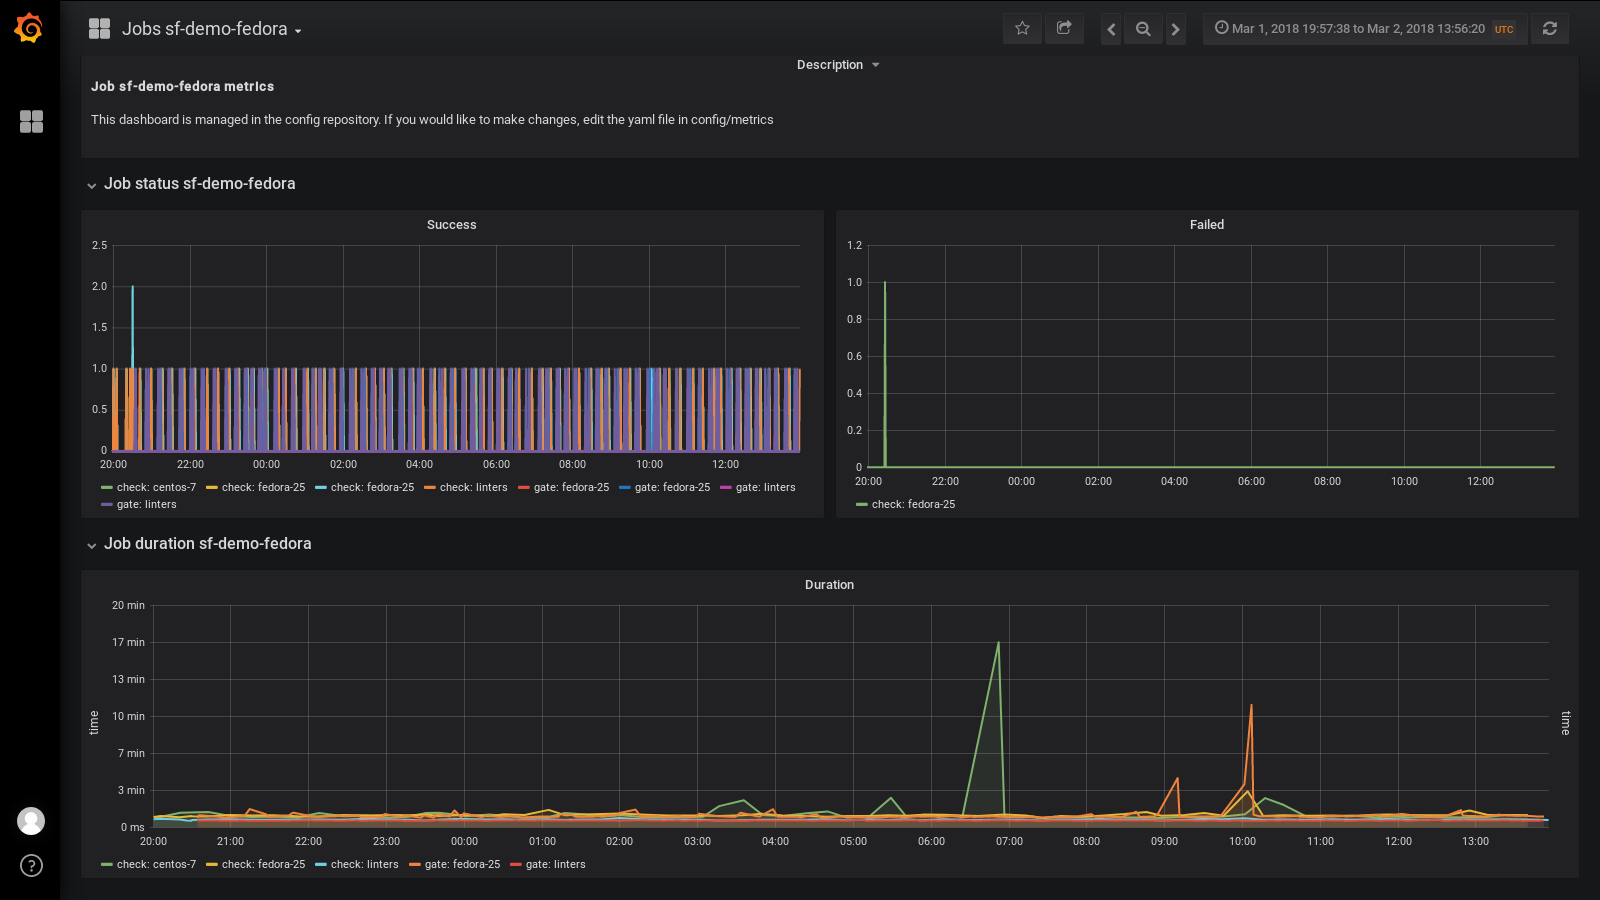
Users can create dashboards for Grafana within the metrics directory in the config repository. These dashboards are written in yaml and will be converted for Grafana using grafyaml.
You can find an example of job dashboard in the config repository (metrics/job.yaml.example). Copy this file to create your dashboard and adapt the JOB_NAME and FQDN variables.
You can find a description of all statsd metrics in upstream documentation.
When a user submit a review with a dashboard in the config repo. The dashboard is validated by the config-update job using the following command:
grafana-dashboard validate $dashboard
When the dashboard is merged, it will be updated on Grafana using the following command:
grafana-dashboard update $dashboard
The validation ensure the dashboard is syntaxically correct.